Datamodelling in Dataverse
This post is part of the Dataverse series.
Recap
Let’s start with a short recap of the past posts: You have already learned that
- Dataverse is more than just another database,
- every Dataverse Environment has a basic set of tables and columns as part of the Common Data Model,
- every custom table will also contain a basic set of columns, necessary for e.g., security, auditing or reporting,
- working with solutions is strongly recommended and will help you with your ALM process,
- you can easily set up a preferred solution and new publisher
- some basics about tables and columns
Entity Relationship Diagram aka ERD
There are now different ways how to start working with Dataverse. And there is nothing wrong if you are e.g., curious and excited to start building something to just open the maker portal, have a look at everything and just experiment and try something in your trial or dev environment. Try everything out, play around, and get used to everything. But chances are high, that you might miss somenthing, get stuck or you are frustrated when something is not working as expected.
As we just learned about the different table and column types, just invest a few minutes more to decide what you want to build to have a great first experience and also have a plan what steps you have to take.
And to visualize your plan, there’s something called Entity Relationship Diagram. And just a little coincidence - tables have been named Entity before and if you are using the Classic Editor, there tables are still named Entities.
Unfortunately there is no build in functionality in Dataverse to build an ERD out of the box, and use it as starting point. Therefore, you have to use different tools to scribble down your thoughts and requirements. For this initial visualization of requirements you can use
- Whiteboard, OneNote, Pen & Paper,
- Visio, PowerPoint, Draw.io, Lucidchart, … use whatever you like, but start by drawing the ERD.
But what is an ERD and what do I have to consider?
- Different types and levels of ERD
- Conceptual – only tables and relationships. The easiest an high level ERD

- Logical – tables, relationships and attributes. Enahnce your Conceptual ERD by adding information about relevant attributes to the tables

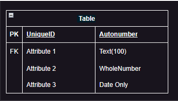
- Physical – tables, relationships, attributes, attribute types & keys.
 The most complex one, where you will add a lot of additional information to the ERD, but this would help you e.g. in a team, that everyone has a better undertsanding and someone else can use this information to create the datamodel within Dataverse for you.
- Conceptual – only tables and relationships. The easiest an high level ERD
- Relationship Information
- Cardinality - max number of instances that exists in a relationship between 2 tables
- Ordinality - min number of instances that exists in a relationship between 2 tables
With this additional infromation, you can not only visualize if we are talking about a 1:N, N:1 or N:N relationship but you can also specify if it is also possible to have e.g., 0,1, or N records for the N or 0 or 1 for the 1. So specifying the minimum number of records also gives you an indication, if the information stored in a relationshiü is mandatory (required).
To visualize these, the crow notation is very popular, and easy to learn to differentiate.
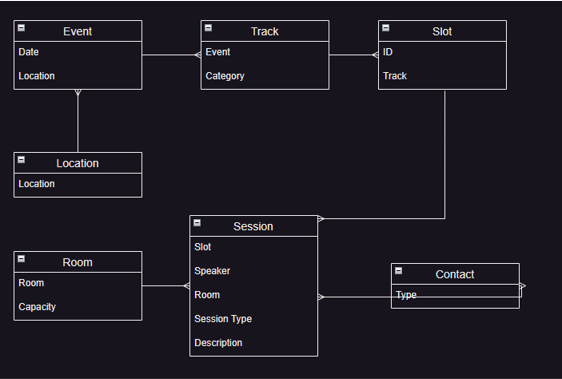
Let’s start with an Example of an Event Data Model
- Which tables are needed?Start by writing down which information you want to capture, then you can decide, if the information is a table, or maybe an attribute on a table. Your event structure can be very simple and just containing e.g., the Event and session table or you can add some complexity by differentiating not only sessions, but also having different tracks, slots, rooms, locations, speakers and participnats, …
- CDM or custom table?Next, recap what you have heard about the Common Data Model. Any information you want to capture is already available? There might be a good chance that you could use Contact table for Speakers or Participants. Or ist this an AND/OR?
- Table types – Standard, Activity, Virtual or Elastic?Not an information that you must track directly within the ERD, but if you have e.g., a SharePoint list, or Aszure SQL Server with location information and you want to reuse exactly this information, AND you might want to have the information in sync - this could be a use case to create a Virtual table based on this existing data. At least now you have the option to decide if this would be a possibility without the need to recreate later on a lot of tables, columns, relationships, forms and views etc. that you otherwise would have build already.
- Table (Lookup) or Choice?Do you need a table to maintain some additional information, or is a choice better to capture this? E.g. location, room, session type, … There is not the one correct answer for this. But think about the information that you want to cover. Is there any additional information that you need? Let’s think about the Room - you could easily have a choice with 5 different rooms - but if you want to store the capacity of each room, or any other information about the room like availability of audio and video system, you could not achieve this with a choice and you would need to create a table instead.
- Relationship types? One-Many, Many-Many or custom Many-Many with Intersect tableInvest a bit of time here. Look at the tables and then decide what is the correct relatonship for your use case. Sometimes it might be very easy and clear, in other cases the first impression might be misleading e.g. the relatonship between a session and the speaker (contact). It could be easily 1 Session can have N Speakers. But then you might have events, where also 1 Speaker can have multiple sessions. Or the speaker can be a participnat in another session as well. So based on your requirements and the flexibility how to maintain the data, you can either have a 1:n, N:1, N:N or even custom N:N relationship between session and contact, where you can add additonal infromation to the intersect table between contact and session, to define in which role both are interacting.

There is even more 😉
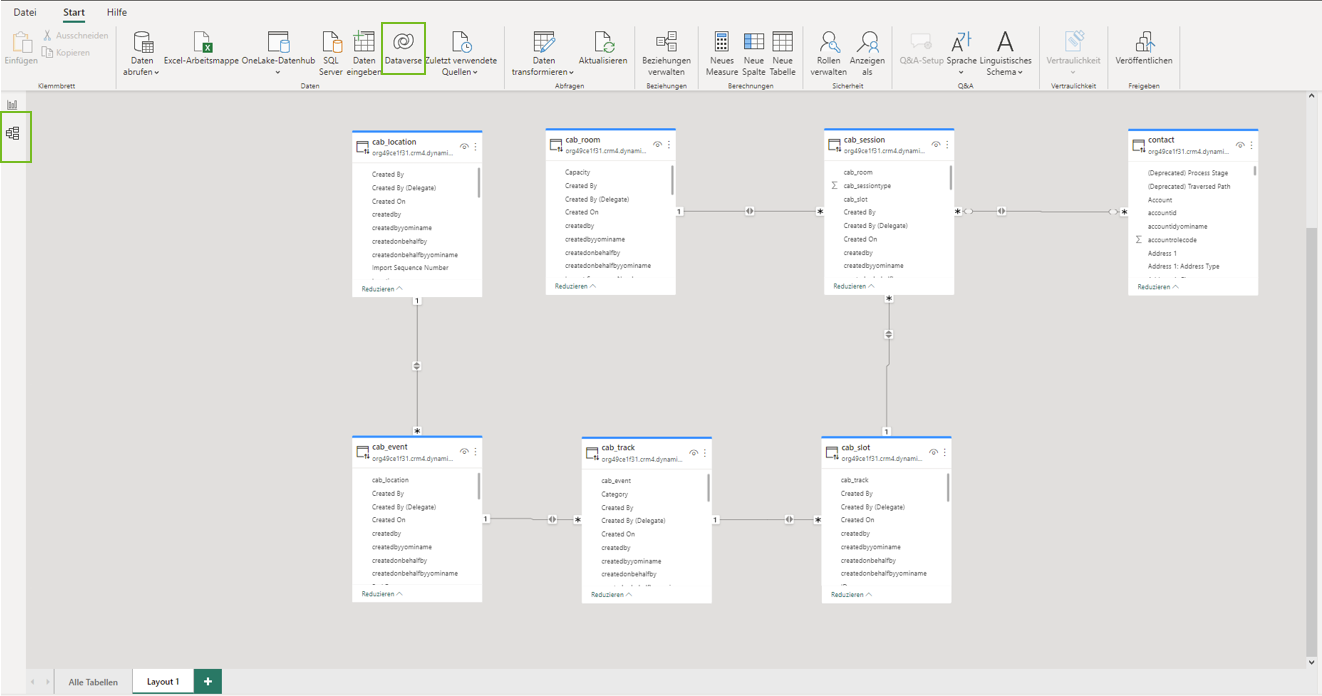
Once you have built everything in dataverse, you can use some tools to visualize the existing datamodel in Dataverse as an ERD. That is very useful, if you want to document what you have built.
Visualization of Dataverse data model
- Power BI

- XRMToolBox (collection of community tools)
- ERD Visio Builder
- ERD Schema Generator
- Entity Relationship Diagram Creator
- UML Diagram Generator
I will post about the usage of XRMToolbox tools in a separate post. So stay tuned.
All parts of this series (22)
- 1. Form Fill Assistance on Columns in Dataverse
- 2. Copilot for Dataverse - New experience
- 4. Copy an existing Model Driven App
- 5. Editing Command Bar in Model Driven Appswith Power FX 2
- 6. Custom Pages in Model Driven Apps
- 7. Editing Command Bar in Model Driven Appswith Power FX
- 8. Dataverse Teams Integration - External Content
- 9. Dataverse Email Integration
- 10. Manage Polymorphic Lookups in Dataverse with XRM Toolbox
- 12. Mapping columns in related Many-to-Many tables
- 13. Mapping Lookup Columns
- 15. Best Practices when working with Dataverse
- 16. Create your own M365 Dev Tenant
- 18. Activate additional languages in Dataverse
- 19. Publishers and Solutions
- 20. Tables and Columns
- 21. Datamodelling in Dataverse
- 22. Introduction to Dataverse
About CRM and Beyond
Jörgen Schladot

Solution Architect
Dynamics 365 CE & Power Platform
@ Avanade Deutschland GmbH
Recent Posts
Tags
Archives


 azure
azure
 copilot
 dataverse
 dynamics365